After the Bubble, What to Buy: Translating Japan's Experience into a China Equity Framework
A Japan-to-China comparison focused on sector ranking, earnings verification, valuation discipline, scenario positioning and the investable consequences of a property-led balance-sheet adjustment.
AI-translated from the Chinese original and editorially reviewed.
The investment conclusion first: do not ask whether China will “Japanify”; ask which cash flows can be re-rated
China’s property adjustment is more likely to be a sector and credit cycle than a permanent verdict on every stock. Japan’s useful lesson for equity investors is not a forecast of how far an index must fall. It is that the index, sectors and company cash flows follow different clocks after a bubble. Property and banks absorb balance-sheet losses; export and productivity sectors can earn relative returns; consumption and services depend on whether household security is rebuilt.
This is an equity research note, not a general social essay. Politics, demography, employment, culture and family behaviour enter only when they explain one of five investable variables: earnings, cash flow, valuation, risk premium or relative performance.
My base case for the next three to five years is low nominal growth, high sector dispersion and a market driven by policy credibility and cash flow, not a synchronous replay of Japan. If China recognises property losses, restructures local debt and shifts fiscal support towards households, consumption, services and quality growth can receive an earnings re-rating. If recognition is delayed, cash flow, dividends and export manufacturing can outperform. If exports cushion the economy while price wars persist, revenue growth may coexist with falling margins.
Figure 1 | The report’s framework. Equity analysis translates macro shock into sector earnings, company cash flow, valuation and position size.
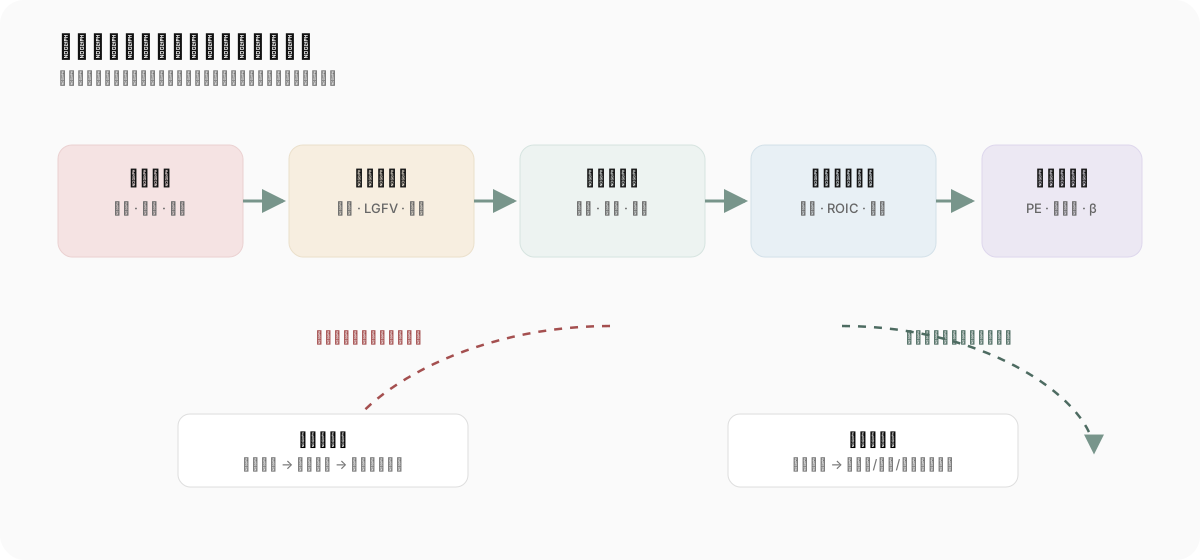
Figure 2 | Original transmission chart. Red dotted arrows show loss allocation and policy delay; green dotted arrows show relative performance and cash-flow re-rating.
Japan after the bubble: an index collapse was only the first fact
1. The biggest mistake after 1989 was treating the market as one sector
The Japanese equity market peaked at end-1989. TOPIX and urban commercial land then fell roughly 70–80% from their highs. Bank of Japan But an 80% index decline does not imply that every stock should be avoided forever. Investors faced three distinct regimes:
- Collateral collapse: banks, property and non-bank finance suffered together; provisions and impairments compressed earnings.
- Delayed deleveraging: rates fell, but firms did not want to borrow; zombie firms occupied credit and labour, leaving the index without earnings upgrades.
- Restructuring and re-rating: NPL recognition, bank recapitalisation and productivity/export companies improved; markets began rewarding cash flow rather than balance-sheet expansion.
BOJ research identifies late-1980s real-estate lending as a major source of the bubble. By 2002 Japanese banks had disposed of more than ¥90 trillion of NPLs; resources committed to the problem were roughly 20% of GDP. BOJ IMES BOJ NPL report
The first equity rule is therefore: after asset prices fall, classify industries as collateral losers or productivity beneficiaries before looking at multiples. Low P/E cannot offset a damaged balance sheet; a high multiple need not be a bubble if earnings, returns on capital and cash flow can keep rising.
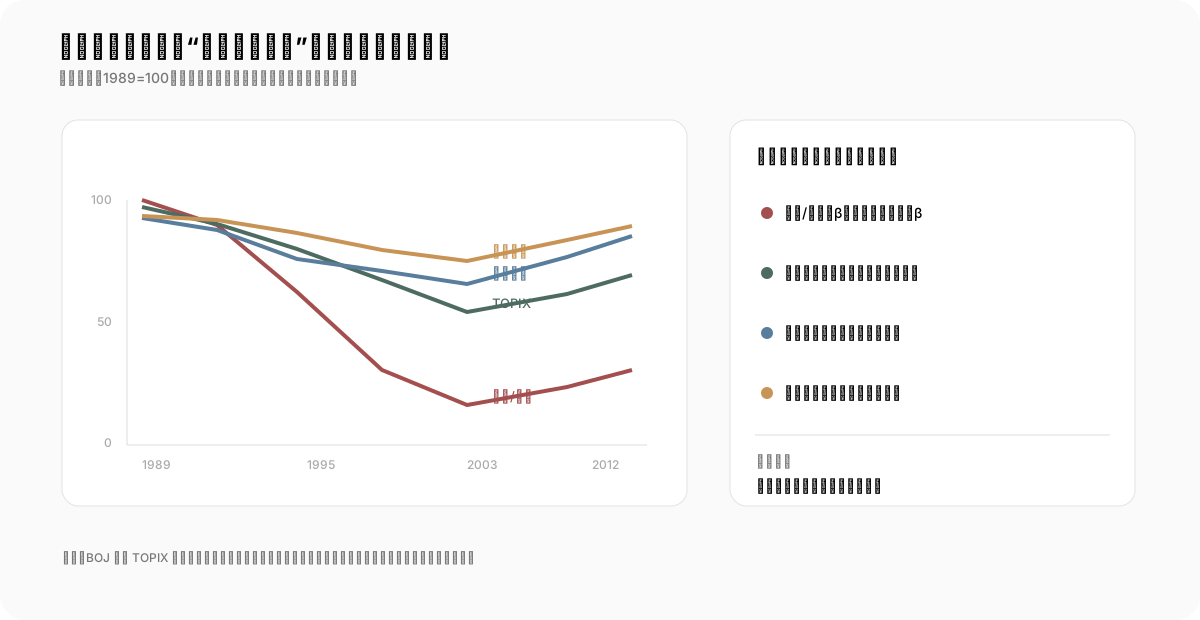
Figure 3 | Original regime chart. Industry paths are standardised mechanism illustrations, not official sector-index backtests.
2. Japan’s “lost decade” was a simultaneous absence of earnings and valuation upgrades
Real GDP growth averaged about 1.5% in the 1990s, down from 4.4% in the 1980s; CPI turned negative only in 1998. BOJ The equity implications of a balance-sheet recession are:
- weak nominal income makes cost pass-through difficult;
- collateral losses make banks more risk-averse;
- firms prefer repayment and cash to capex and acquisitions;
- earnings estimates are repeatedly cut, so rebounds look like valuation repair rather than a new bull market.
The dangerous feature is not one large down day but the absence of right-side earnings confirmation. A low policy rate can make stocks cheaper without making them worth owning if nominal GDP, margins and returns on capital do not improve together.
3. Social change enters the income statement
Labour-market duality delayed young adults’ household formation, marriage and children. That weakened housing, durables and education demand. Consumption shifted towards value retail, convenience, second-hand goods and lower fixed costs. OECD data show Japanese non-regular employment rising from around 20% in 1990 to nearly 34% in 2010. OECD
For investors this is not cultural trivia. It is demand composition: luxury, property and leveraged durables depend on wealth effects; discount and convenience formats can gain relative resilience; healthcare and ageing services can grow, subject to payer and regulatory limits; internet, games and content have low-fixed-cost appeal, but cultural popularity is not shareholder return.
Translating Japan into China: what is actually being traded
1. 2025 data show property contraction alongside industrial dispersion
China’s property development investment was RMB8.28 trillion in 2025, down 17.2% year on year. Fixed-asset investment excluding rural households fell 3.8%, private investment fell 6.4%, and tertiary-sector investment fell 7.4%. NBS property NBS fixed investment
Industrial profits were not uniformly collapsing. Above-scale industrial profits rose 0.6%; manufacturing profits rose 5.0% and high-tech manufacturing profits 13.3%. Computer, communications and electronic equipment profits rose 19.5%; rail, ship, aerospace and other transport equipment rose 31.2%; electrical machinery rose 4.9%; automobiles rose only 0.6%; chemicals fell 7.3%; coal mining fell 41.8%. NBS industrial profits NBS interpretation
This does not support “all Chinese equities are Japanified,” nor “high-end manufacturing is an automatic bull market.” It supports a narrower thesis: property and traditional cyclicals face margin and balance-sheet pressure while equipment, electronics, power infrastructure and selected export chains can grow structurally. The equity question is whether output becomes distributable cash flow.
2. Four balance sheets determine relative performance
China’s adjustment links households, developers, local governments and banks:
| Balance sheet | Variable | Direct pressure | Potential relative winners |
|---|---|---|---|
| Households | Housing wealth, mortgages, jobs, propensity to consume | Property, home improvement, discretionary goods | Staples, healthcare, lower-ticket services |
| Developers | Sales cash, land, presales | Property, materials, steel, construction machinery | Stock renewal, social housing, public services |
| Local governments | Land revenue, tax, LGFV refinancing | Local infrastructure, local SOEs, exposed banks | Grid, central SOEs, nationwide public investment |
| Banks | Collateral, NPLs, net interest margin | High property/LGFV exposure | Strong capital, low funding cost, sounder assets |
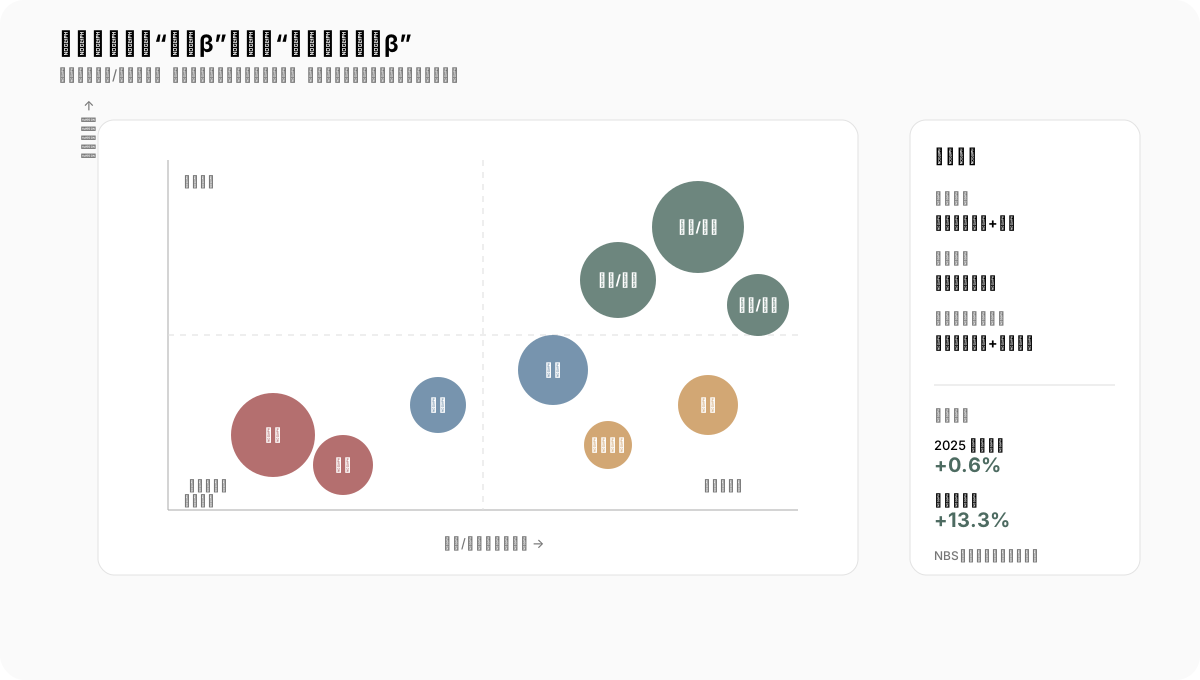
Figure 4 | Original sector map. Positions are the author’s property-sensitivity/earnings-visibility framework, not ratings. Even the upper-right needs valuation and cash-flow verification.
3. Politics, economics and culture matter only when they change the risk premium
After Japan’s bubble, politics shifted from distributing new growth to allocating losses. Delayed bank resolution and fiscal hesitation kept corporate expectations weak. For Chinese equities, policy therefore affects not only growth but the credibility of loss recognition.
Track actions rather than slogans: Does central fiscal policy absorb part of the delivery and local-debt loss? Do banks recognise NPLs and replenish capital? Do private firms receive predictable financing and regulation? Does social protection reduce precautionary saving? Does industrial policy raise returns on capital rather than simply expand supply?
Demography and culture also enter risk premia. Population decline constrains aggregate housing demand and labour supply, but does not eliminate per-capita healthcare, ageing, automation and premium-service demand. Delayed family formation makes household spending more cautious, while increasing the need to separate single-person, elderly, pet, convenience, healthcare and mobility demand rather than treating “consumption” as one index.
Sector allocation: what deserves research, and what is only a rebound trade
The following is a research priority, not a buy list.
A. High property exposure: recognise losses before using historical P/E
Developers, home-related materials, some construction machinery and property-heavy banks can look cheap while earnings keep falling. Japan’s experience says low multiples during collateral deflation may precede provisions, impairments and capital calls. Ask whether projects can be delivered, inventory can clear, off-balance-sheet risk is disclosed, capital covers a stress case and cash comes from sales rather than new borrowing.
Only when sales, inventory, completions and NPL recognition improve together can property beta evolve from a rebound trade into a cyclical recovery trade.
B. Banks: asset quality before lower rates
Two bank narratives are often conflated: high dividend as a cash-flow strategy, and property restructuring as an asset-quality strategy. Lower rates can compress net interest margin; LGFV swaps can reduce interest pressure without removing principal losses.
Compare property and LGFV exposure, provision coverage, delinquency migration, source of capital, funding cost and dividend policy. A P/B re-rating needs a peak in NPL pressure and stable return on equity. Banks are not “macro stability”; they are the accounting vehicle through which losses are allocated.
C. Staples and services: income confirmation, not just stimulus headlines
China’s 2025 disposable income per person was RMB43,377, up 5.0% in real terms; consumption expenditure rose 4.4%, while net property income rose only 1.6%. NBS household income
Consumer research should ask whether income comes from stable wages, whether price rises preserve gross margin, and whether stores and channels generate free cash flow. Staples are not automatically defensive if price wars force branded companies to buy revenue with discounts.
D. Grid, equipment and digital infrastructure: test policy beta with ROIC
Equipment and instrument investment rose 11.8% in 2025; equipment-manufacturing profits rose 7.7%; electronics profits rose 19.5%. NBS communiqué NBS interpretation
These sectors may benefit from the energy transition, compute and automation, but policy support can create overcapacity and price competition. Track order quality, receivables, utilisation, overseas revenue, capex payback and ROIC. Structural growth must produce cash, not merely move profit into customer receivables.
E. Export and advanced manufacturing: a floor, with margin risk
Japan’s manufacturing and exports provided relative returns after the bubble, but export revenue is not automatically shareholder return. Chinese manufacturers face demand, tariffs, currency, input costs and domestic price wars. Separate companies with technology or brand pricing power from scale/cost competitors and single-market policy bets. The first group is better placed to defend free cash flow and returns on capital.
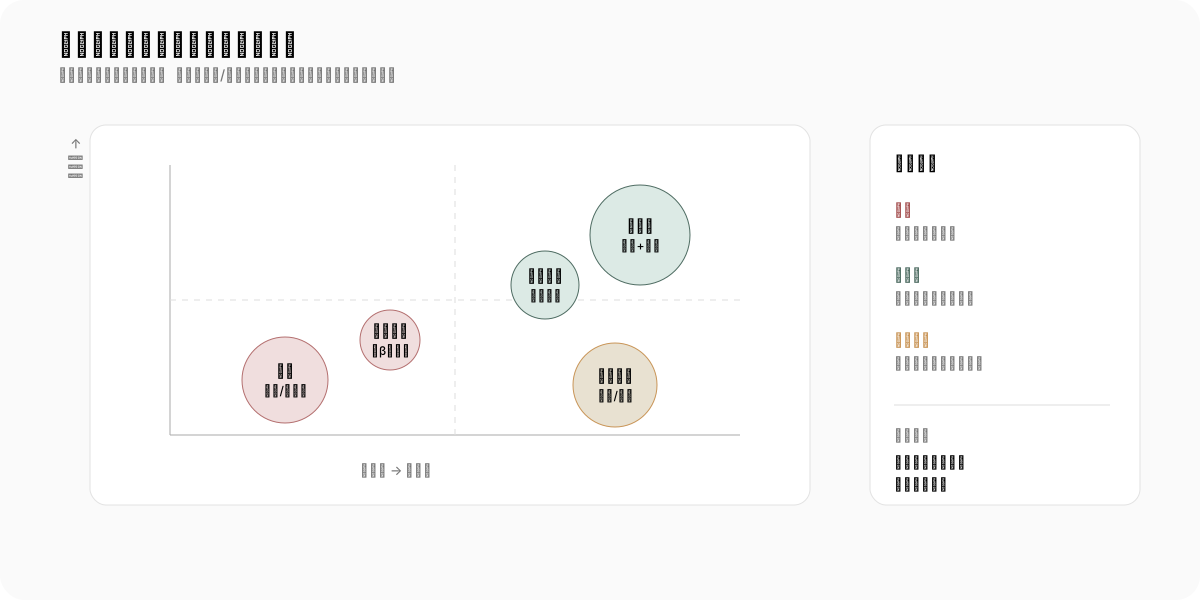
Figure 5 | Original scenario matrix. Bubbles represent sector baskets, not price targets. Position size should move with confirmation data.
Three scenarios and their equity logic
Scenario 1: managed rebalancing—domestic demand is re-rated
Central fiscal policy funds delivery, unviable local-debt restructuring and bank capital; housing clears through discounts, social housing and public-service reform; social spending improves household security.
Equity implication: property may rebound after clearing, but durable leadership is more likely to come from consumption, services, quality growth and banks whose asset quality improves. Confirmation is simultaneous improvement in consumption, core CPI, private hiring, sales cash and NPLs.
Scenario 2: Japanese-style delay—cash flow and dividends lead
Extensions, debt swaps and low rates avoid a crisis, but inventory clears slowly, nominal growth stays weak and capex remains defensive. Themes can rebound without broad earnings upgrades.
Equity implication: high free cash flow, dividends, low leverage, governance improvement and overseas earnings form the base. Property and banks require strict position limits until asset quality turns. The worst trap is a company that looks cheap while estimates are cut every year.
Scenario 3: exports and industrial upgrading cushion the economy
Advanced manufacturing, AI, power equipment and exports offset property, but price wars and trade friction split margins.
Equity implication: prefer companies with verifiable technology, customers, cash flow and overseas channels. Discount capital-intensive capacity additions with weak bargaining power. The index can rise while winners become unusually concentrated.
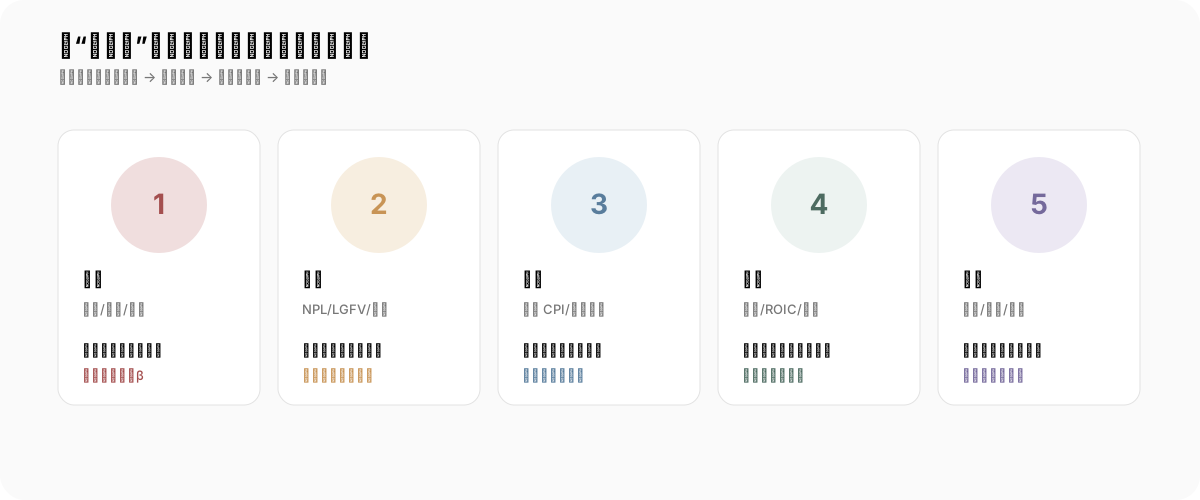
Figure 6 | Original investor dashboard. Increase cyclical/high-beta exposure only when at least three of the five indicators improve together.
Turning the report into an investment process
- Define scenarios rather than point forecasts. Write base, upside and downside paths for property, prices, domestic demand, exports and policy speed.
- Choose a benefit mechanism. Cash-flow defence, policy capex, export productivity, consumption recovery or asset-quality repair—keep one or two mechanisms per portfolio sleeve.
- Rank sectors first. Score property sensitivity, earnings visibility, balance-sheet strength, policy dependence and valuation percentile.
- Translate output into cash. Check operating cash flow, receivables, inventory, capex, free cash flow, dividends and buybacks—not only revenue and orders.
- Stress-test. Test a 10% revenue decline, 300bp margin compression, slower receivables, higher funding cost and currency movement.
- Set falsification rules. Reduce exposure when estimates are repeatedly cut, ROIC falls below cost of capital, capex does not pay back or support becomes price competition.
For a household investor, a more robust portfolio language than “bet on Japanification” is: core holdings in low-leverage, cash-generative, dividend-quality businesses; satellite holdings in structural growth with order and ROIC evidence; cyclical exposure only when property, prices and credit improve together. A home, a property stock, a local bank and a property-linked job may be one local balance sheet, not four diversified assets.
Five equity mistakes to avoid
Low P/E is not automatically a margin of safety. If provisions, impairments and price wars keep cutting earnings, the static multiple rises.
State support is not shareholder return. Policy may protect capacity and jobs without protecting margins. Find the value-chain participant with pricing power.
Population decline does not mean every consumption category declines. Total population, households, age structure, per-capita spending and payer differ.
Macro data are not market expectations. Stocks trade outcomes relative to forecasts. Good industrial profits can disappoint a high-expectation sector; bad property data can precede a rally if fully priced and policy credible.
Japan is not a timetable. Rates, exchange rates, banks, demographics and capital-account regimes differ. The comparison offers mechanisms and risk boundaries, not “another X years of decline.”
Conclusion: the equity answer is dispersion, not replay
Japan’s deepest equity lesson is that a stagnant index does not erase every sector or company opportunity. Nor do low rates, low P/E and policy support guarantee earnings recovery. China combines property contraction, population decline, local fiscal pressure and manufacturing upgrading, so no single macro variable will determine equity leadership.
Three practical statements follow:
- Property and banks are loss-recognition trades, not simple value trades.
- Equipment, electronics, digital infrastructure and exports are productivity trades, but must pass ROIC, cash-flow and price-war tests.
- Consumption, healthcare, ageing and services are household-balance-sheet repair trades, dependent on income, protection and nominal-price recovery.
Studying social life is useful only when it answers the equity question: when households stop treating property appreciation as their only security, firms stop levering without limit and governments stop relying on land for incremental resources, which companies can create more cash with less capital? That is the investable translation of Japan’s experience.
Scope and sources
Information is current to 15 July 2026. Evidence prioritises the Bank of Japan, China’s NBS, IMF, OECD, World Bank, BIS and HKEX. The sector map, scenario matrix and dashboard are the author’s frameworks, not backtests, recommendations or price targets.
Key sources: BOJ bubble and NPL research, BOJ post-bubble growth and policy, NBS property data, NBS industrial profits, NBS 2025 communiqué, IMF China 2025 Article IV, World Bank WDI, and HKEX China Enterprises index material.